

List and filter
The Journeys tab lists every journey in your company. Search by journey id or user, pick a time window, and filter by the events a journey must contain, whether it has a trace, whether a trace had an error, and which model the traces used. Use these filters to find the journeys you want to inspect.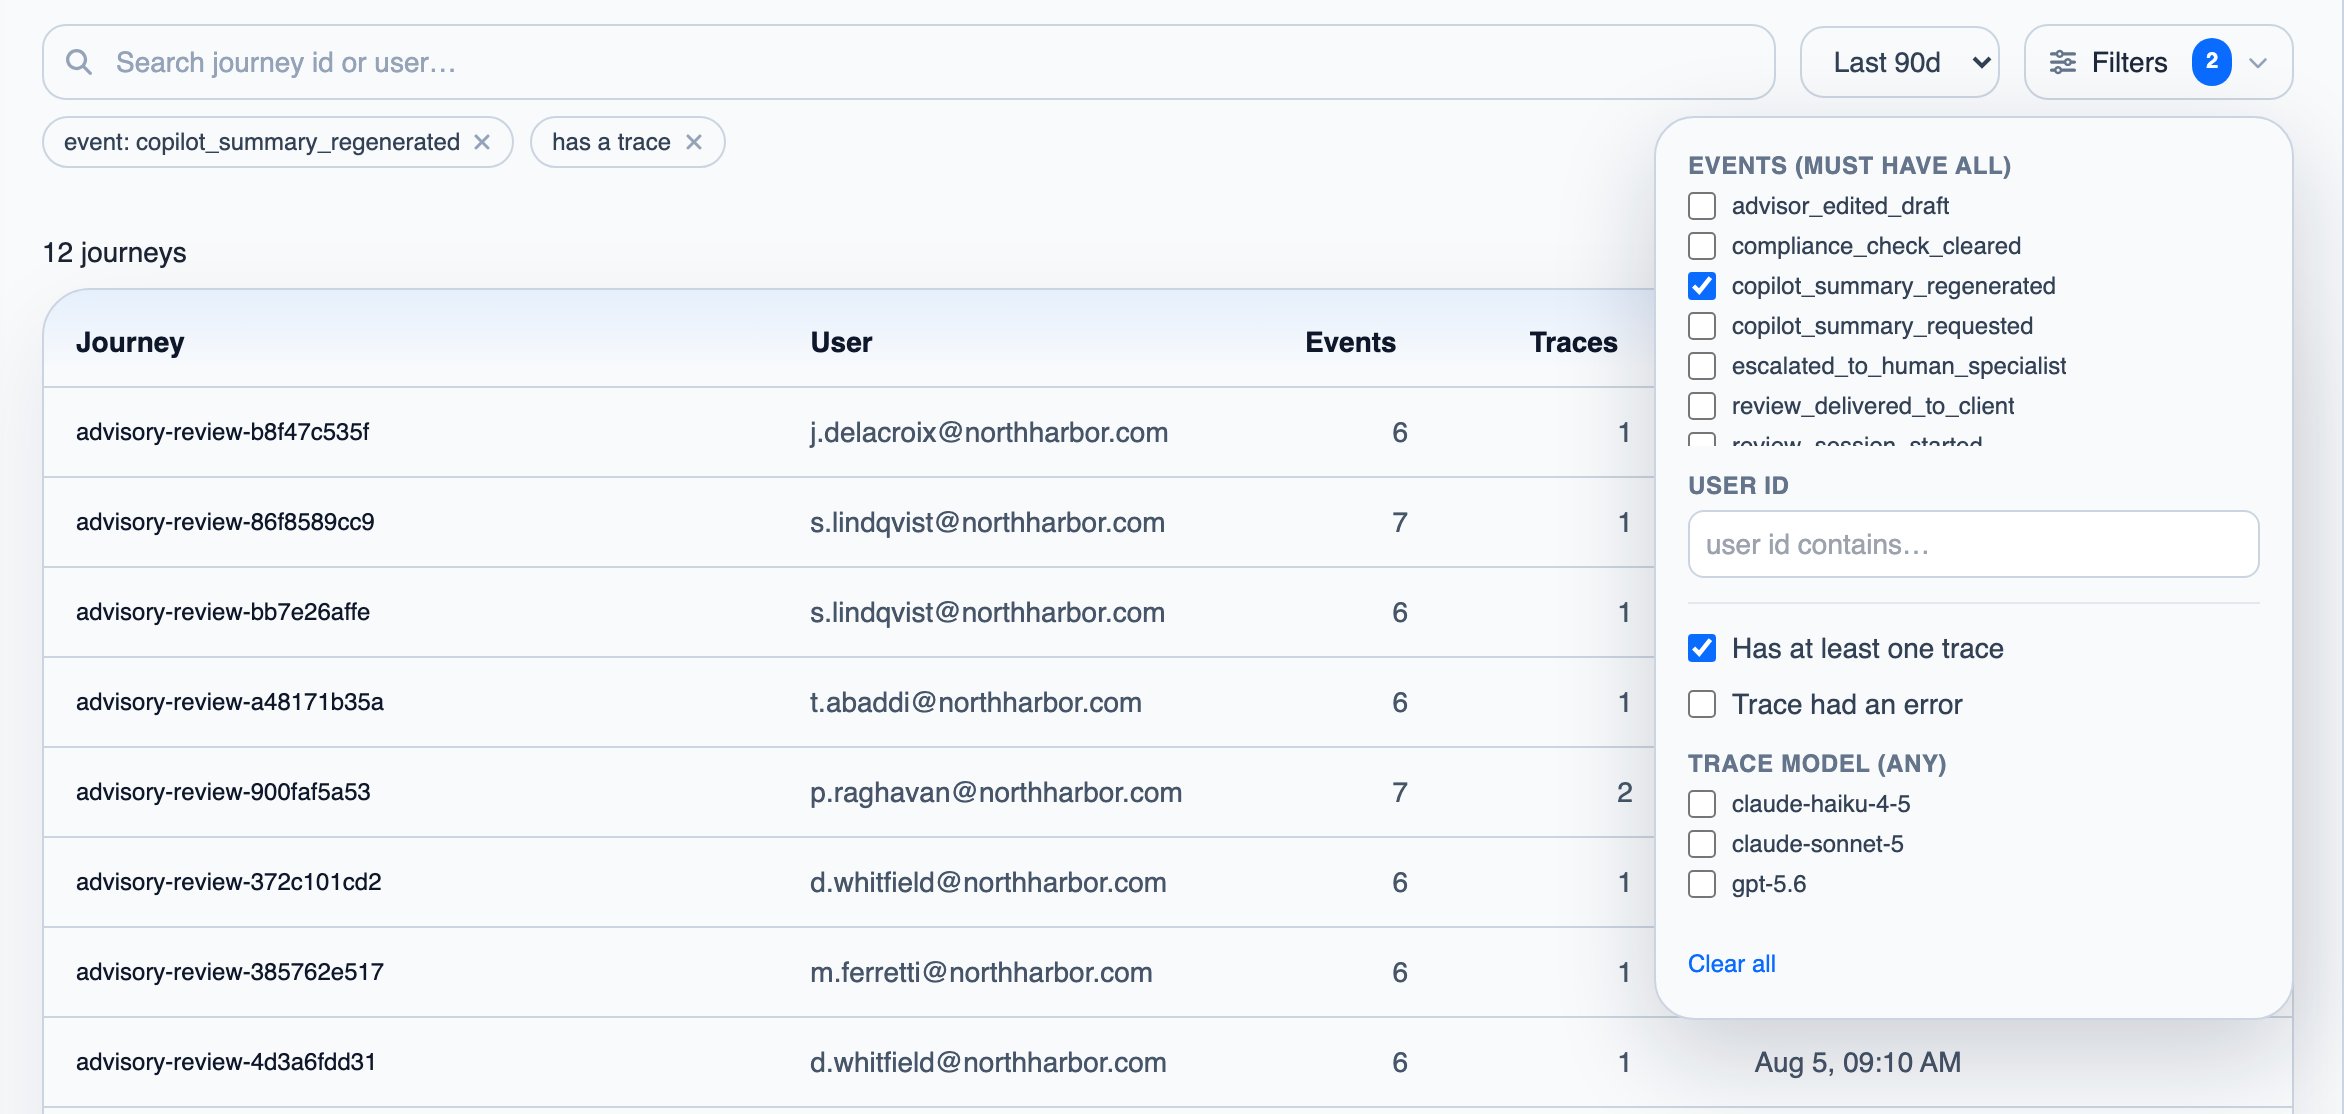
Open a journey
Open a journey to see its full timeline: an event, then an AI trace, then more events, maybe a trace from a different agent, in the order the user experienced them. Click any trace to inspect its input, output, status and execution details without leaving the page.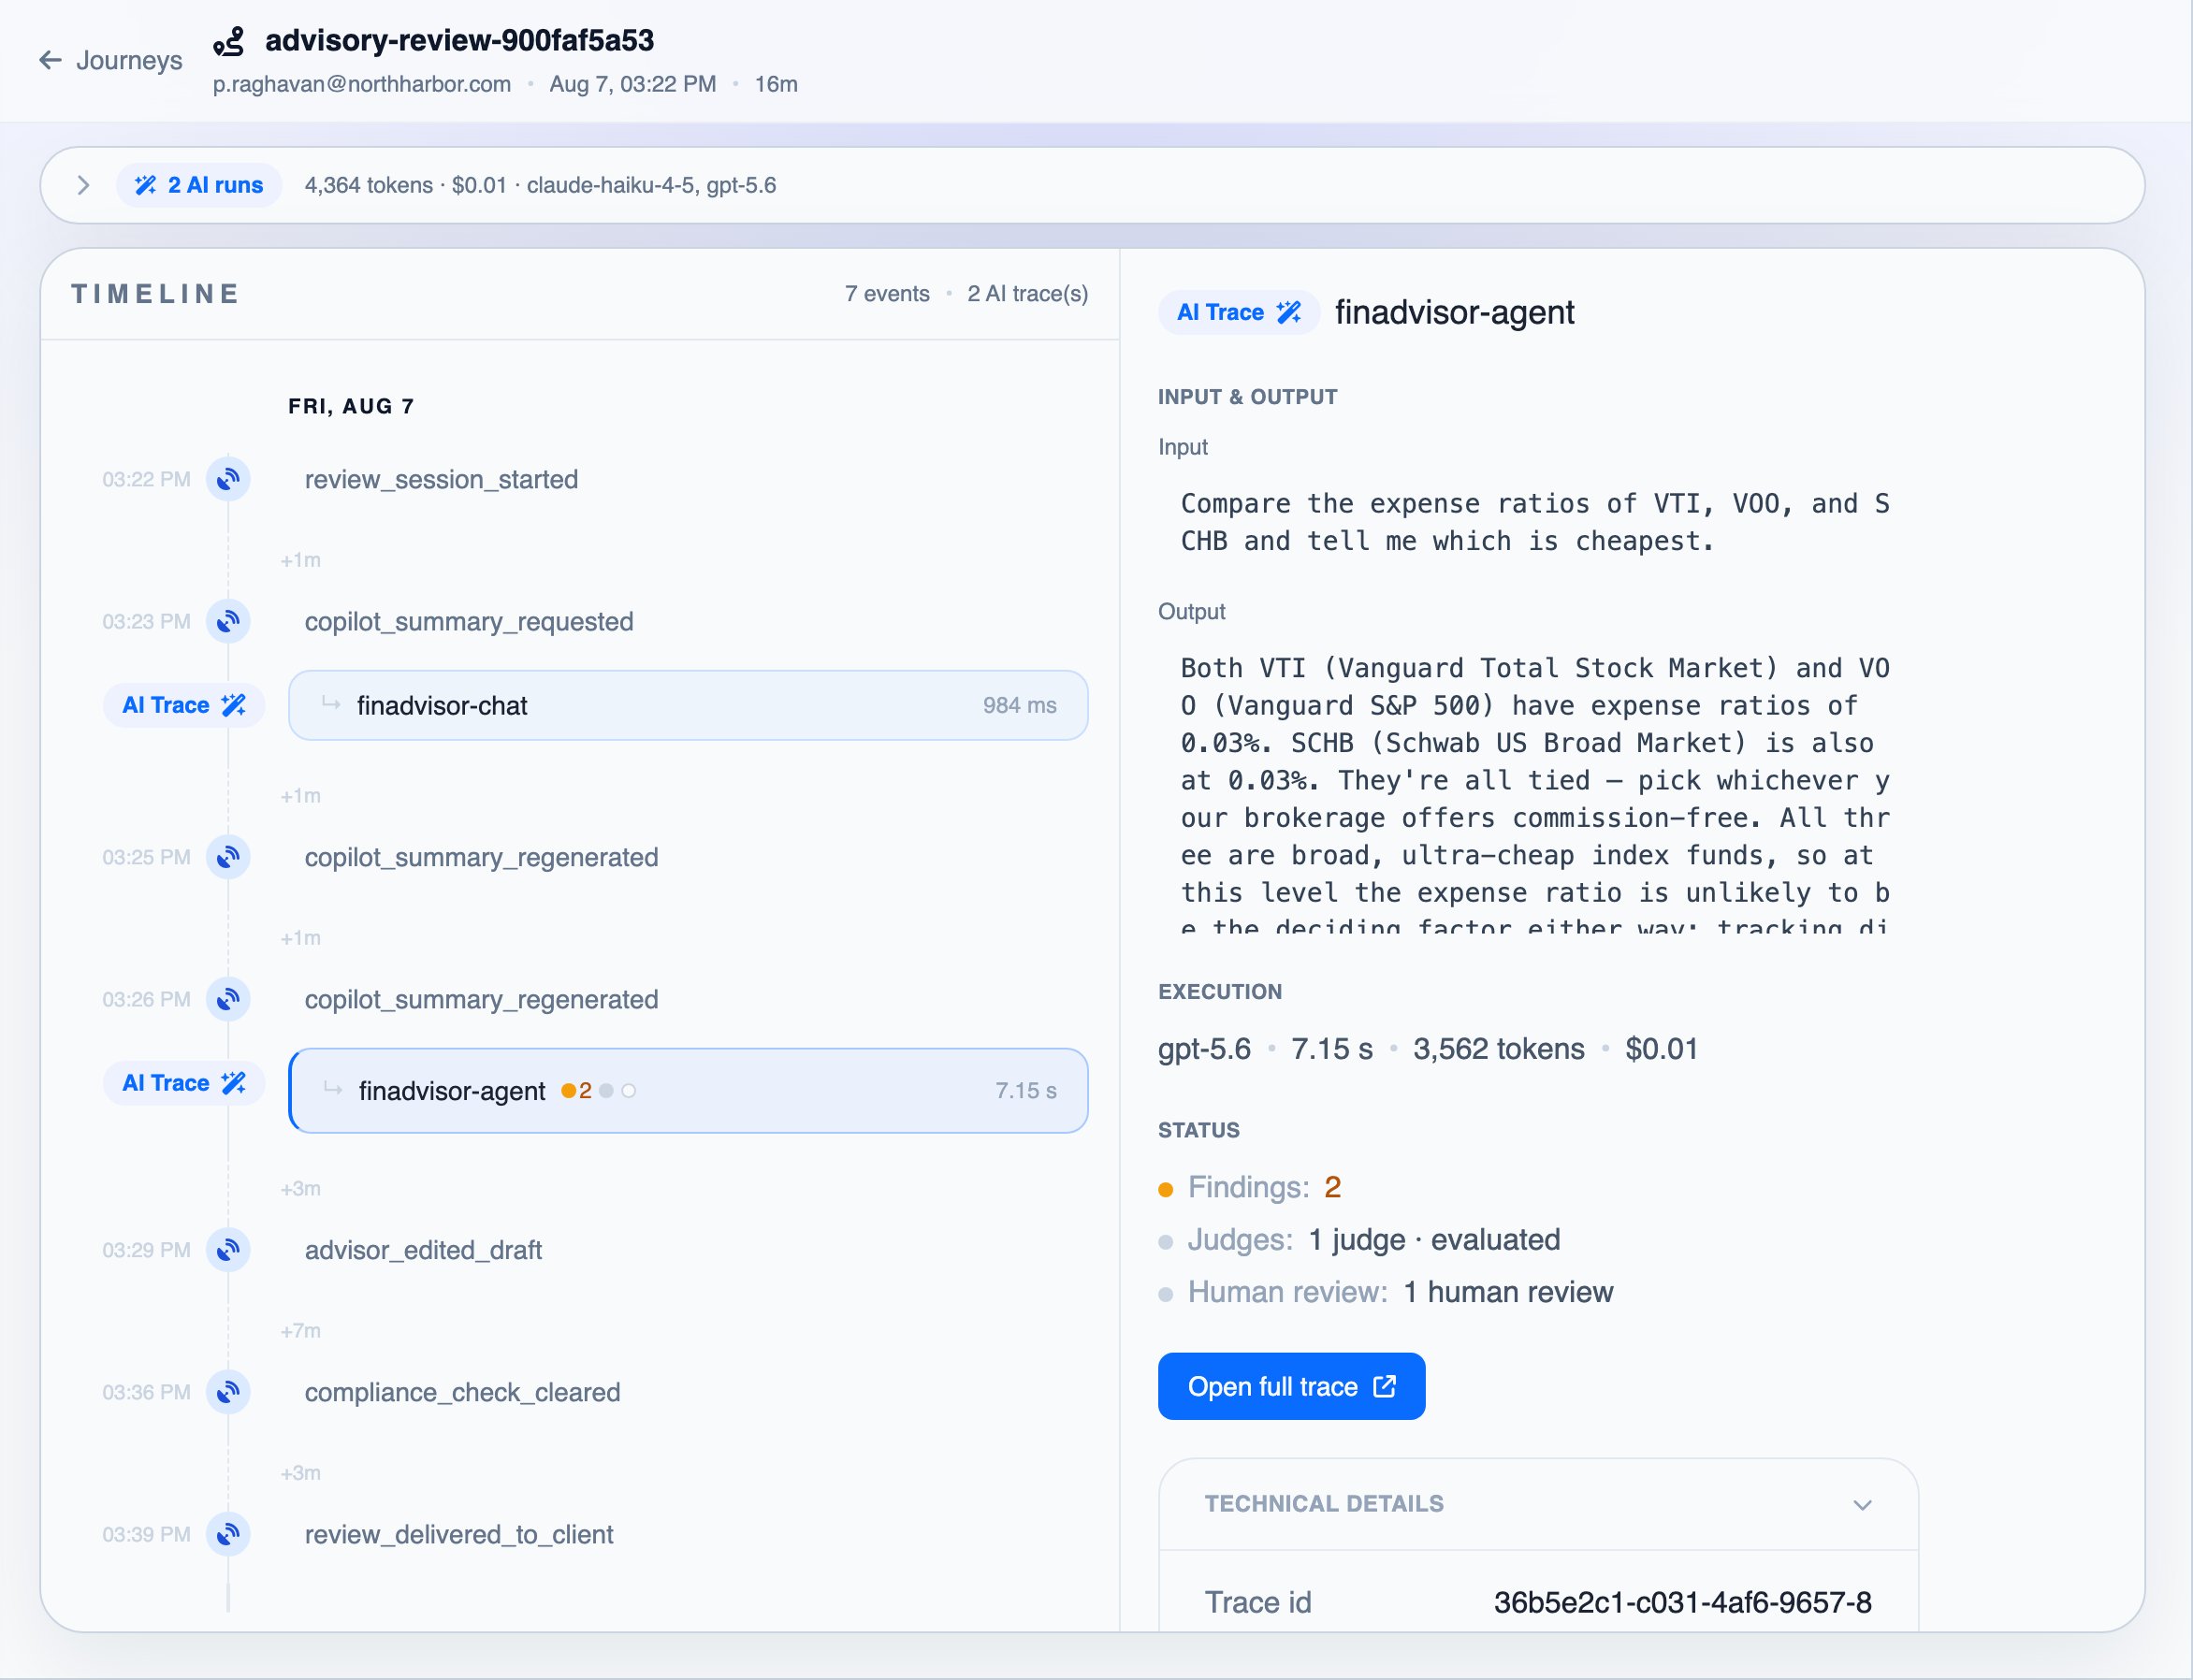
Live Events and Connection
The two other tabs, Live Events and Connection, are for checking your signal setup. See Check that it works.Next steps
Dashboards & Metrics
See counts, trends, and funnels across all your journeys
Findings
Discover failure patterns across the traces inside your journeys