

Widgets
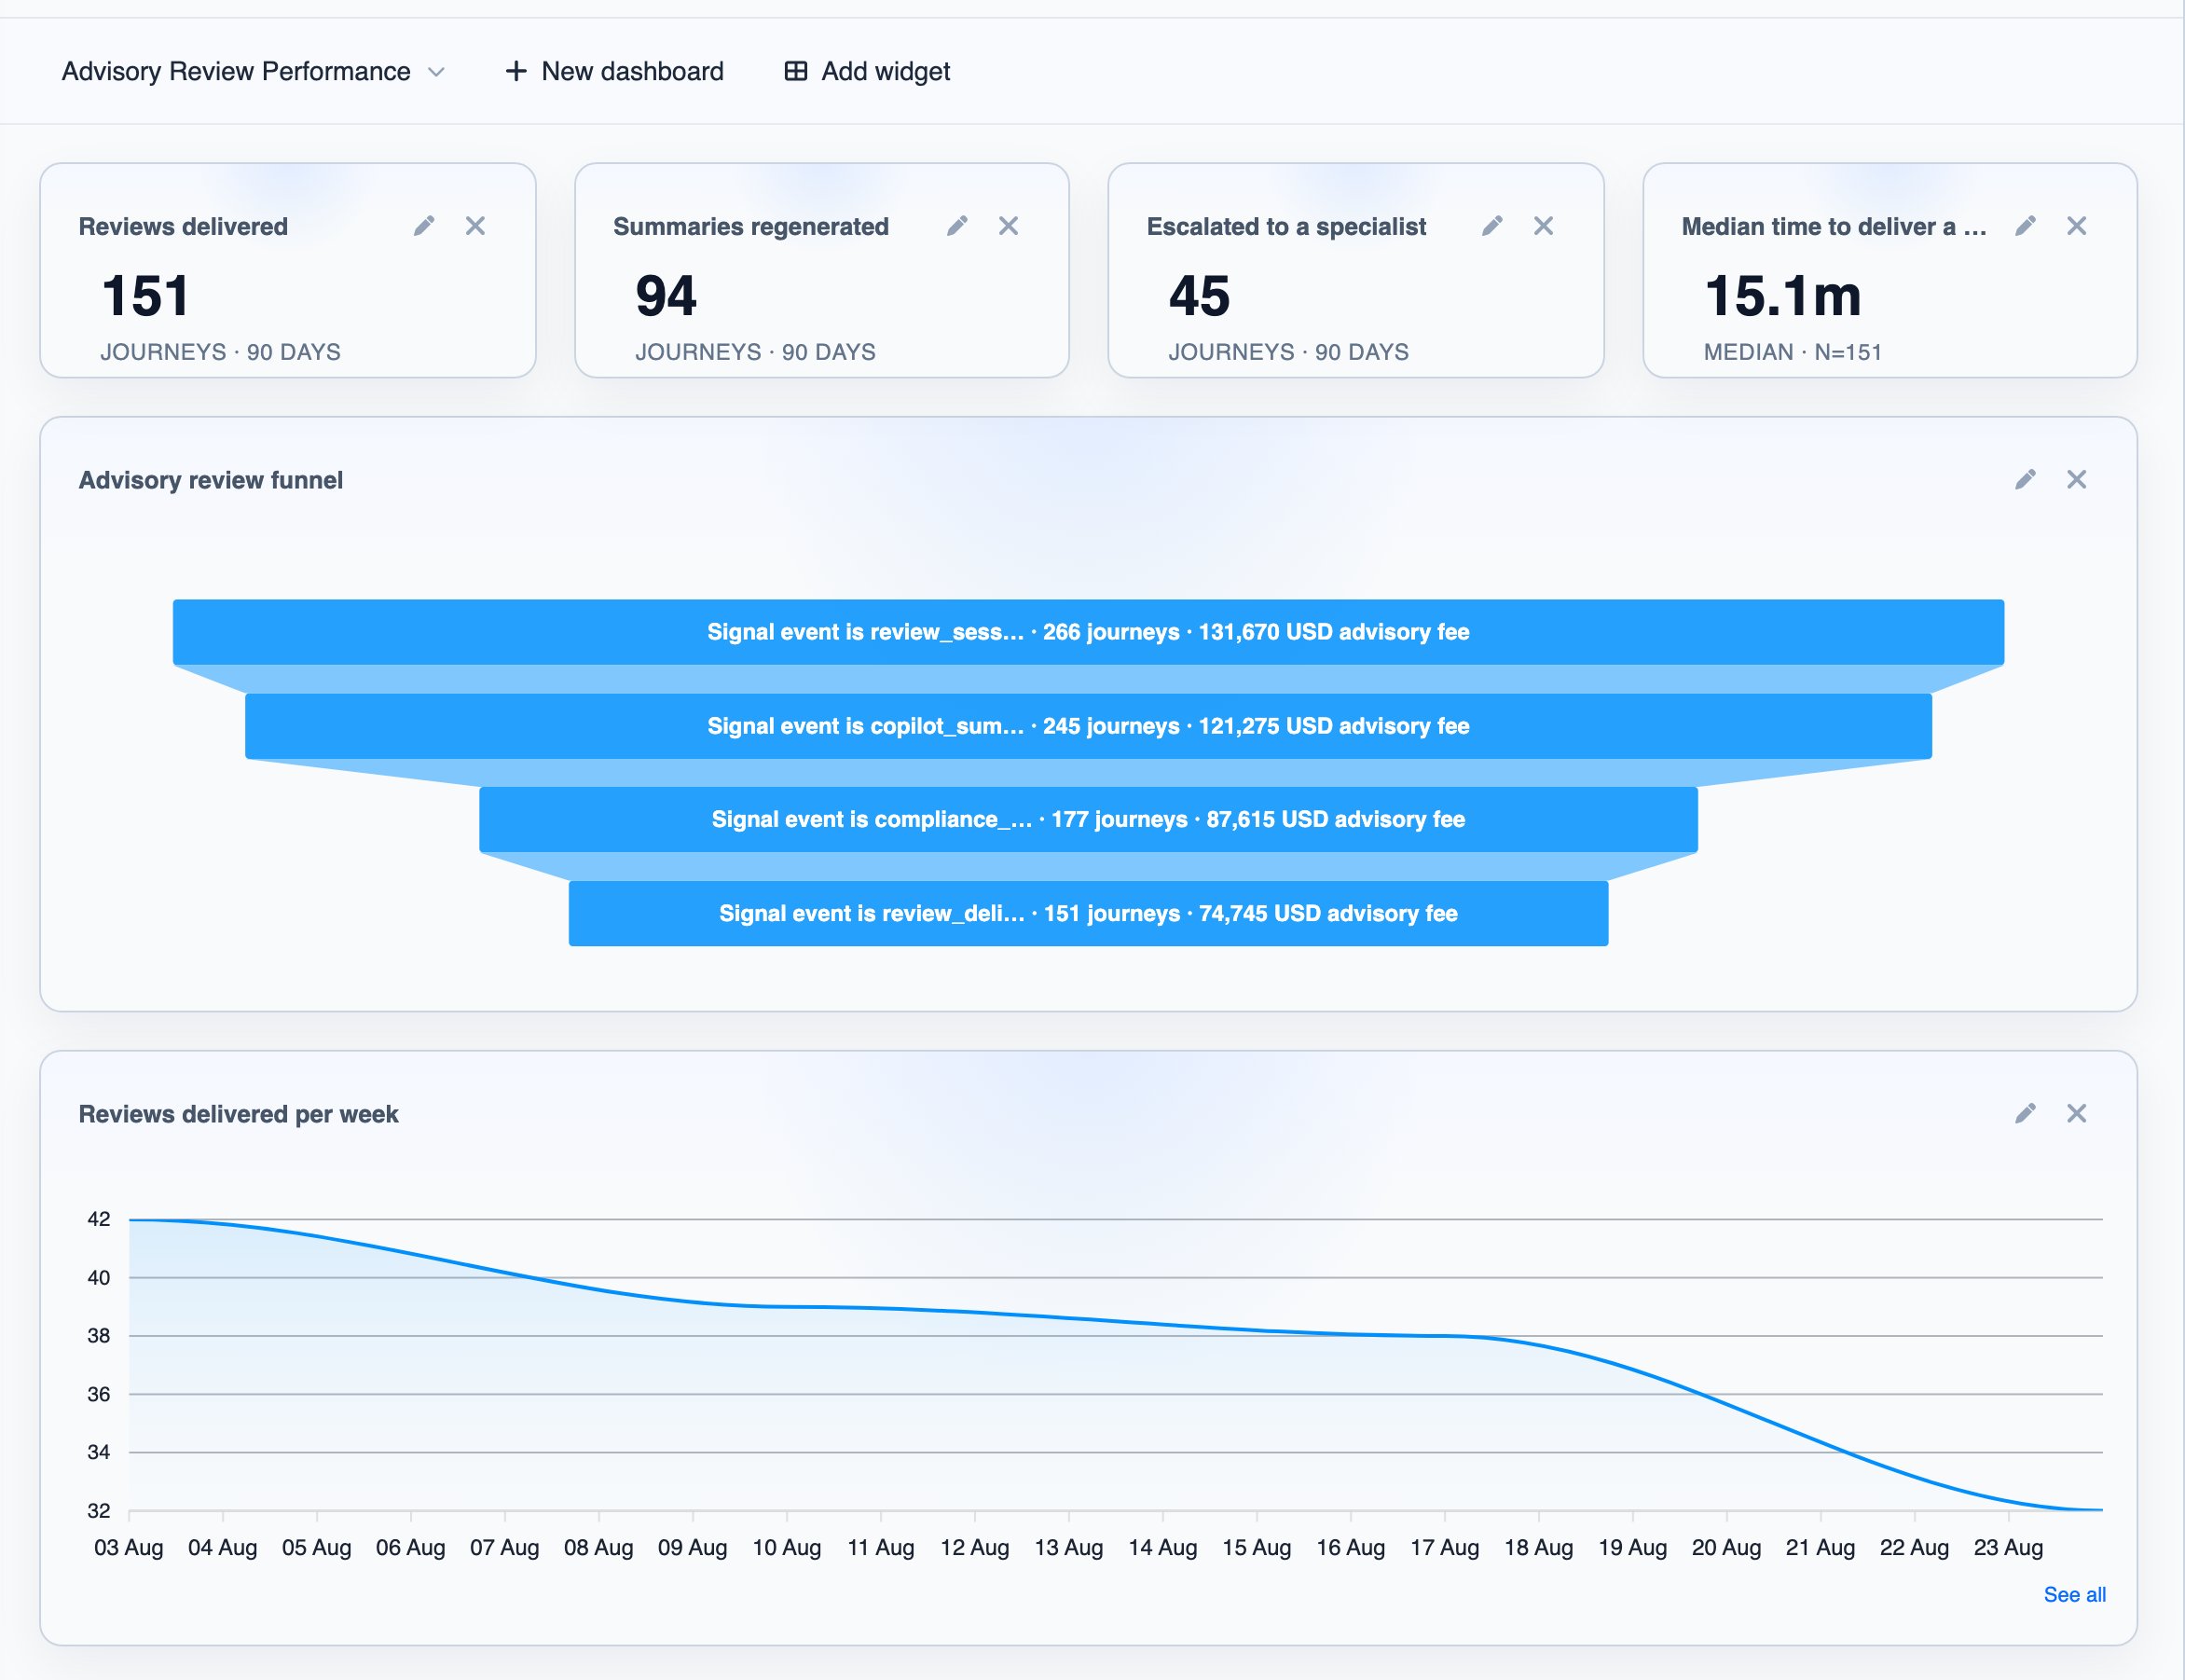
A dashboard is a company-level board of widgets. Each widget is one chart or tile, of one of four kinds:
Every widget has a window (24 hours to 90 days) and at least one condition; an events widget needs only the event to count. Number and Line Chart also take a measure, the thing being counted:
- Journey side: journeys, or users. Each counts once, however often an event occurred in it.
- Events: each occurrence of the event you pick, so a journey that fired it three times adds three. Any conditions select the journeys the events must belong to.
- Trace side: traces, total trace cost, average trace latency, or trace error rate. So LLM spend and error rate are ordinary widgets that you filter like any other.
Conditions
Conditions narrow a widget. You build each one in the widget builder, no code: an event and its properties, or a trace field such as cost, latency, error count or judge score. Cycle time asks for them as Starts when… and Ends when…, and a funnel takes a set per step.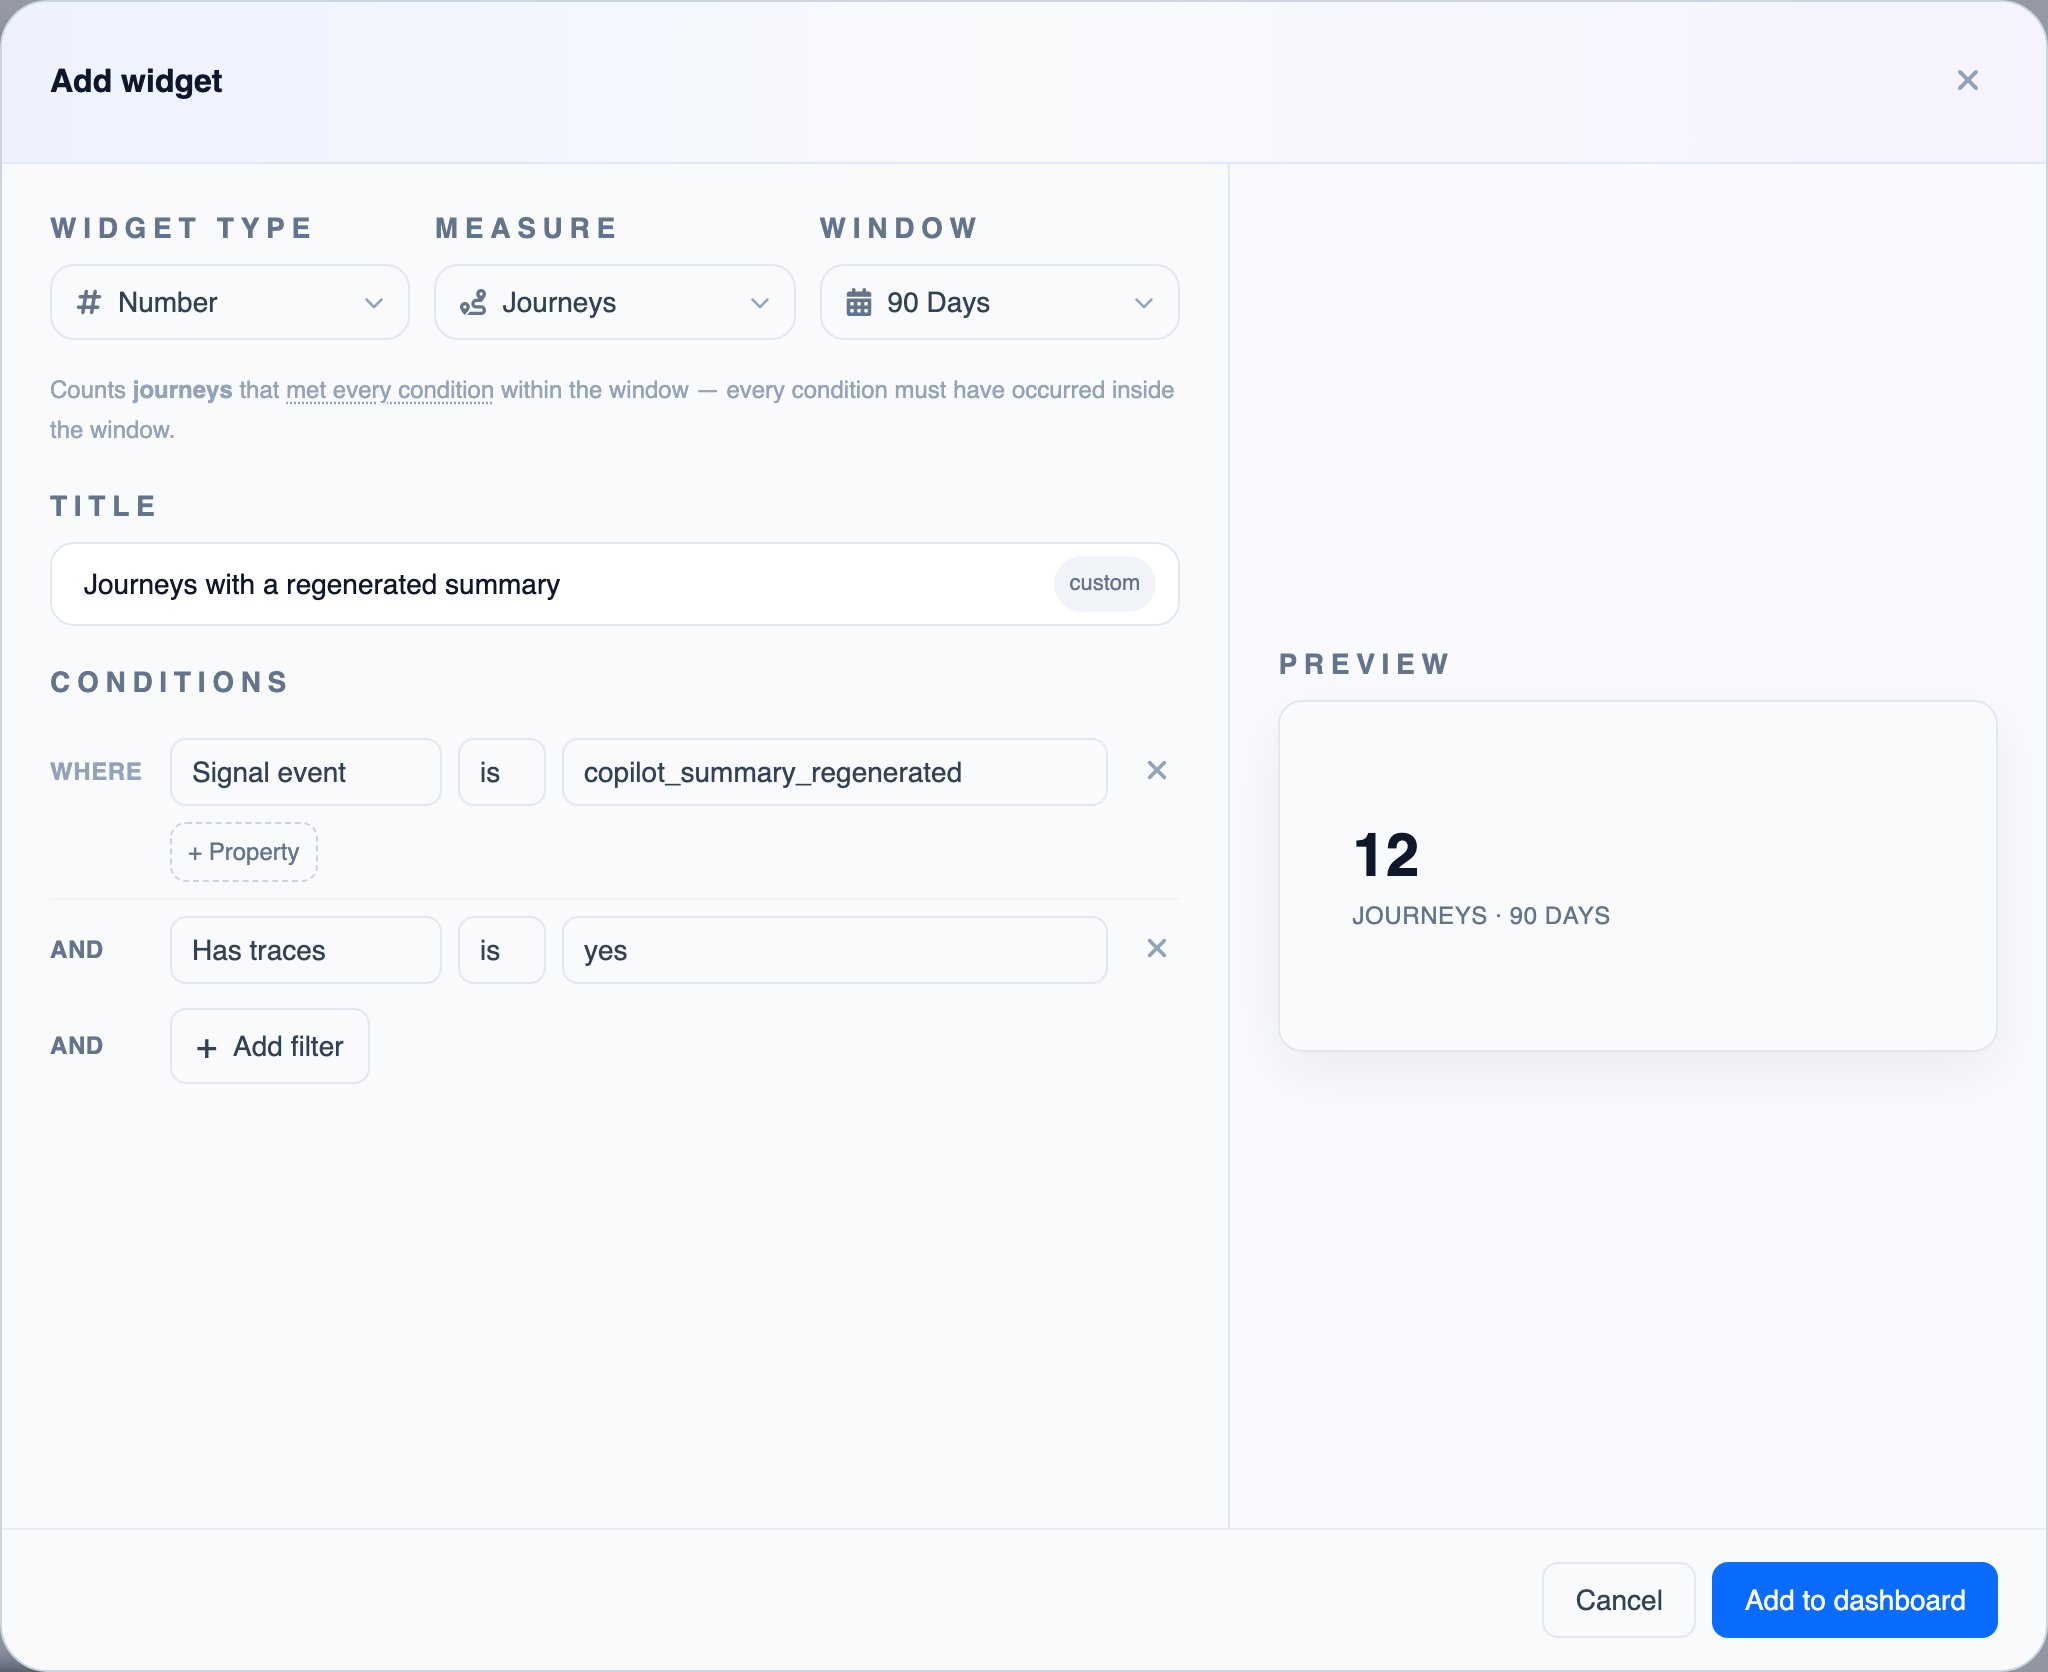
Drilling into a widget
Widgets are clickable, except users and events widgets. Select a point, bar, funnel step or tile, and a panel lists the exact journeys or traces behind that number.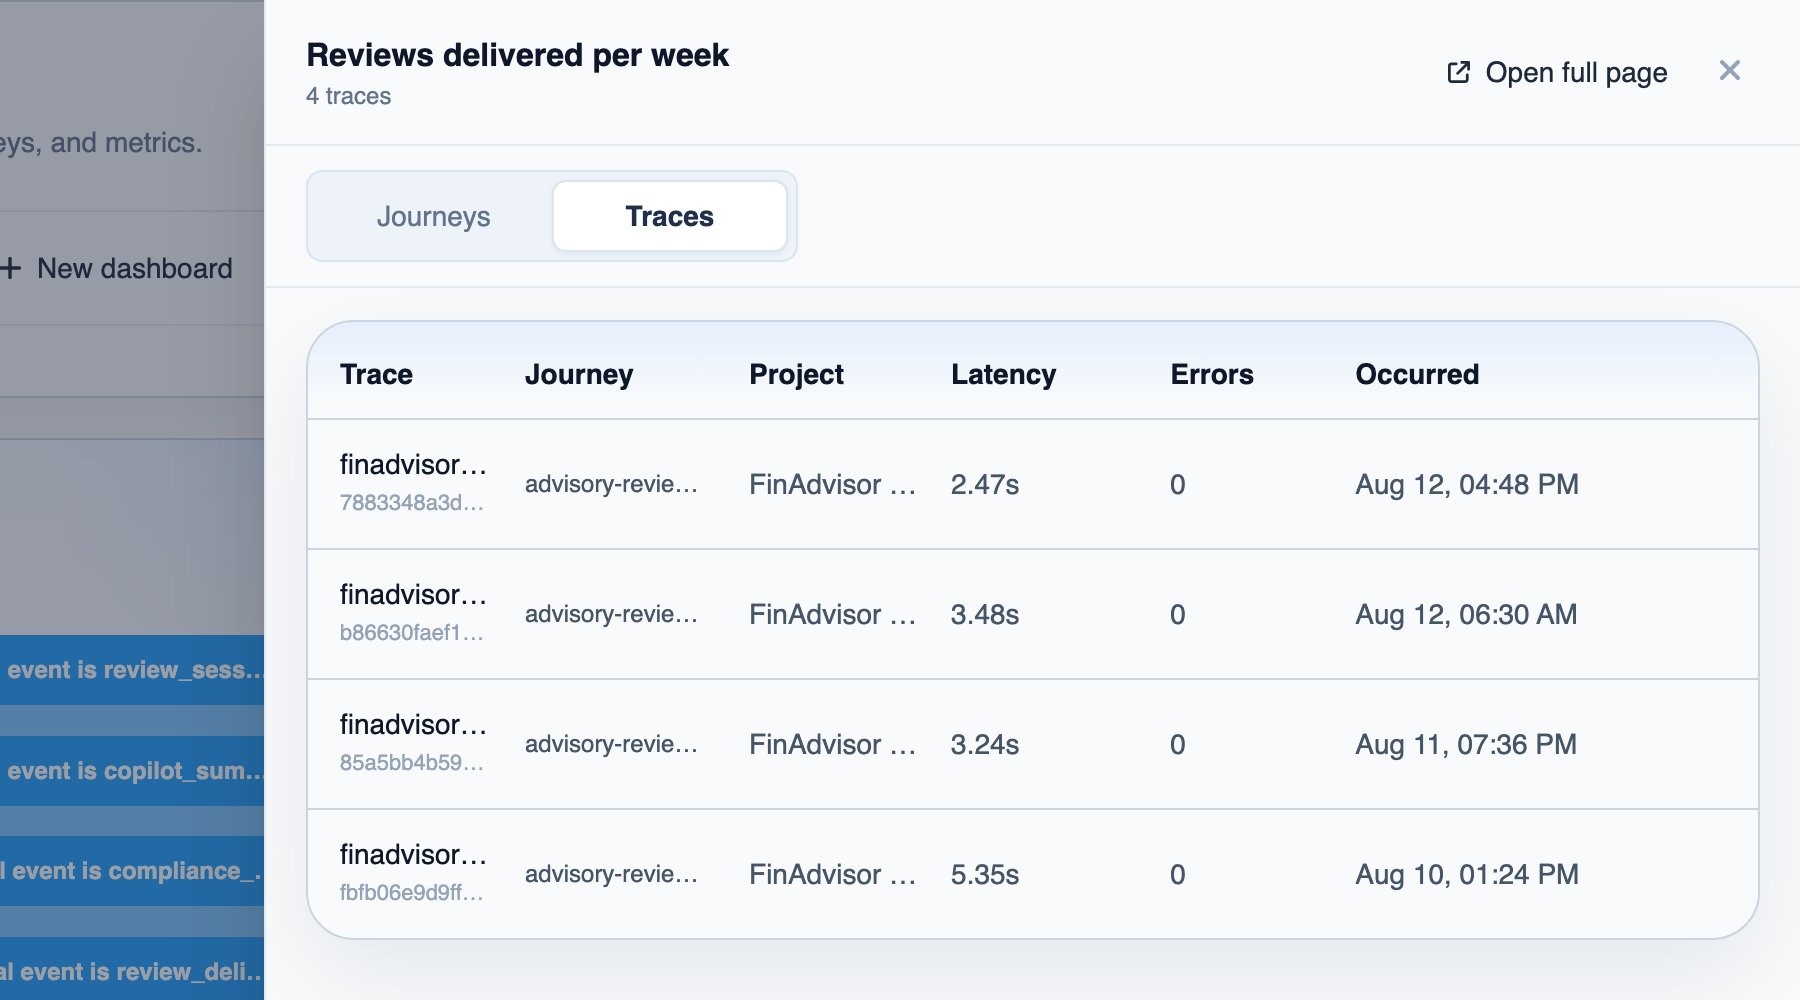
Funnels and value
Each funnel step can carry what one journey reaching it is worth: an amount, plus an optional label. The funnel then shows not only how many journeys got through, but what that flow was worth, for example in revenue or cost.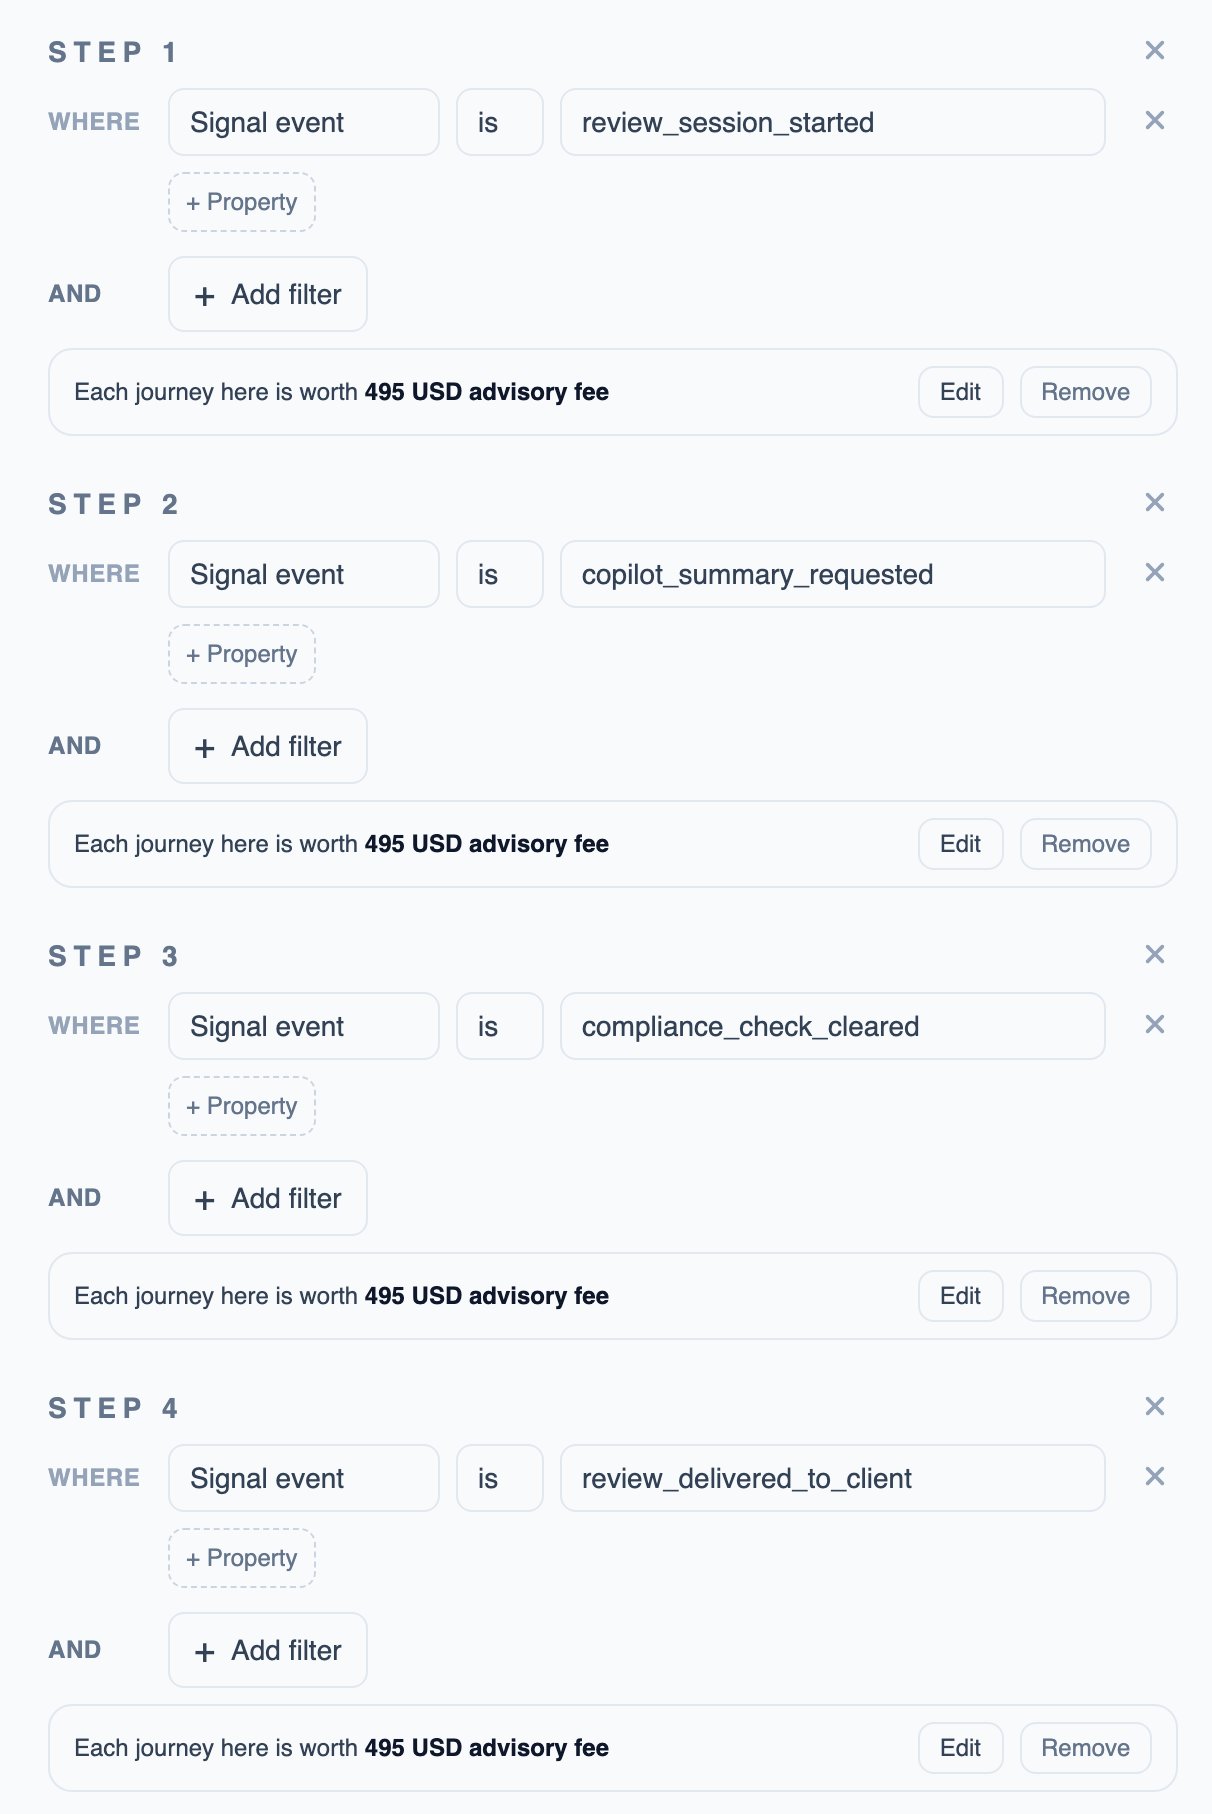
Next steps
Journeys
Browse the individual journeys behind these numbers